Aortic valve
Introduction
The aortic valve regulates blood flow from the left ventricle to the aorta, and its dysfunction can significantly impact cardiac output. The two primary pathologies are aortic stenosis (AS), marked by narrowing of the valve, and aortic regurgitation (AR), where the valve fails to close, causing blood leakage. Echocardiography is the key tool for assessing aortic valve disease, providing vital information on valve function, disease severity, and its effect on the heart. This section focuses on AS and AR, highlighting their features, clinical significance, and the role of echocardiography in diagnosis and management.
What is aortic stenosis?
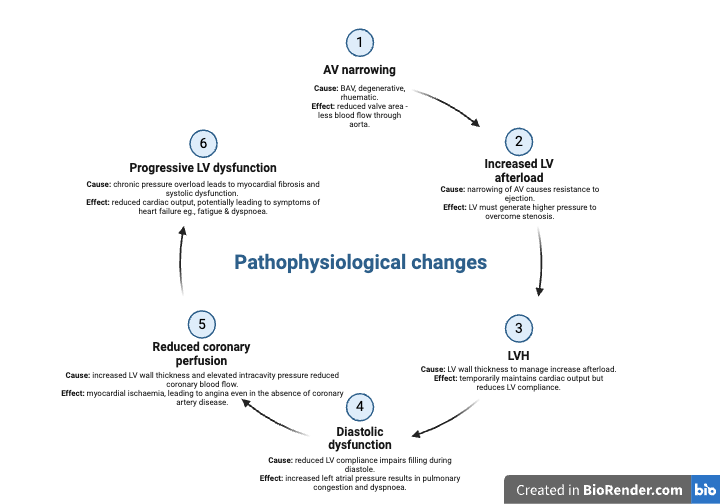
Aortic stenosis (AS) is a condition characterised by the narrowing of the aortic valve opening, which obstructs blood flow from the left ventricle to the aorta during systole. This narrowing increases the resistance the heart must overcome to pump blood, leading to elevated pressure within the left ventricle and progressive left ventricular hypertrophy. Over time, the increased workload can result in diastolic dysfunction, reduced cardiac output, and eventually heart failure.

Clinical presentation & decompensation
Aortic stenosis (AS) often remains asymptomatic in its early stages as the left ventricle compensates for increased afterload. As the disease progresses, classic symptoms emerge, including dyspnoea (from elevated pulmonary pressures), angina (due to reduced coronary perfusion), and syncope (caused by inadequate cardiac output). These symptoms signal clinical decompensation, where the heart can no longer compensate, leading to heart failure with fatigue, worsening dyspnoea, and oedema. Without timely valve replacement, severe AS and decompensation are associated with high mortality.
Echocardiographic assessment of AS
Echocardiography is the gold standard for evaluating aortic stenosis (AS), providing detailed insights into valve function and its impact on the heart. The continuity equation is crucial for calculating the aortic valve area (AVA), enabling precise grading of AS severity. Peak and mean pressure gradients, derived from Doppler imaging, assess the degree of obstruction to blood flow. Additionally, left ventricular hypertrophy (LVH), a compensatory response to increased afterload, is evaluated to understand disease progression. In cases of low-flow, low-gradient AS, echocardiography distinguishes between true severe AS and pseudo-severe AS, aiding in accurate diagnosis and treatment planning.
Doppler assessment
Below is a short video explaining the acquisition of AV Vmax. Depending on which country you’re from, the values may differ slightly.
Aortic valve area (continuity equation)
The aortic valve area (AVA) is a critical parameter in assessing the severity of aortic stenosis (AS). It represents the size of the valve opening through which blood flows from the left ventricle into the aorta. In normal individuals, the AVA is typically greater than 2.0 cm². As the valve narrows in AS, the area decreases, with severe AS defined by an AVA of less than 1.0 cm². Valve area is particularly important because it provides a direct measure of obstruction severity, which may not always correlate with pressure gradients, especially in cases of low-flow, low-gradient AS. By calculating the AVA, clinicians can confirm the presence and severity of AS, guide treatment decisions, and monitor disease progression.
How to calculate AVA
The continuity equation is a fundamental principle used in echocardiography to calculate the aortic valve area (AVA) in aortic stenosis (AS). Based on the conservation of mass, it assumes that the volume of blood flowing through the left ventricular outflow tract (LVOT) is equal to the volume passing through the narrowed aortic valve. The equation is expressed as:
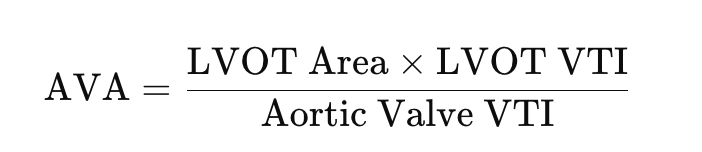
The LVOT area, is derived from the LVOT diameter, while the velocity-time integral (VTI) reflects the distance travelled by blood during systole, rather than velocity, through the LVOT and the aortic valve. The continuity equation is especially useful for accurately grading AS severity, even in cases where pressure gradients may be misleading, such as in low-flow states. Its non-invasive nature and reliability make it a critical tool in echocardiographic assessment.
Practical application
- Measure LVOT Diameter:
- Use the parasternal long-axis view during systole.
- Measure at the base of the aortic valve annulus.
- Ensure precise measurement, as small errors significantly affect the calculated LVOT area.
- Calculate LVOT Area:
- Use the formula LVOT Area.
- Maintain consistency in measurement to avoid variability.
- Record LVOT VTI:
- Use pulsed-wave Doppler in the apical 5-chamber or long-axis view.
- Align the Doppler beam parallel to blood flow for accurate measurements.
- Record Aortic Valve VTI:
- Use continuous-wave Doppler through the narrowed aortic valve.
- Optimise the alignment of the Doppler beam to maximise signal quality.
- Calculate Aortic Valve Area (AVA):
- Apply the continuity equation:
- Confirm values are consistent with other parameters (e.g., gradients).
Important considerations
- Precise LVOT Diameter: Measure in the parasternal long-axis view during systole, perpendicular to the LVOT. Small errors significantly affect calculations. If it’s a repeat scan try and use the same diameter as previous.
- Doppler Beam Alignment: Align the beam parallel to flow for accurate LVOT and aortic valve VTI measurements.
- Consistent Sampling: Place the LVOT Doppler sample just below the valve annulus to avoid turbulence.
- High-Quality Waveforms: Ensure clear Doppler signals with well-defined envelopes.
- Repeat Measurements: Average multiple readings, especially in irregular rhythms like atrial fibrillation.
- Cross-Check Parameters: Correlate valve area with pressure gradients and clinical symptoms for consistency.
- Advanced Imaging: Use 3D echocardiography or TOE if imaging quality is poor.
- Operator Skill: Ensure proper training and technique to minimise variability.
Severity grading
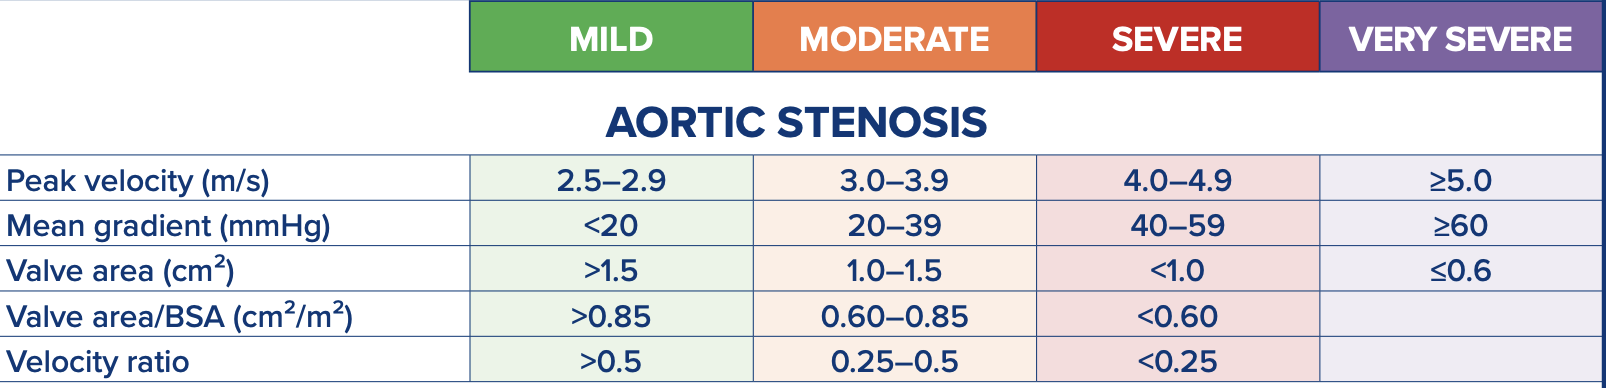
Depending on the region you are from, values may differ. Below is an example of the British Society of Echocardiography’s guidelines.
Tips for reporting
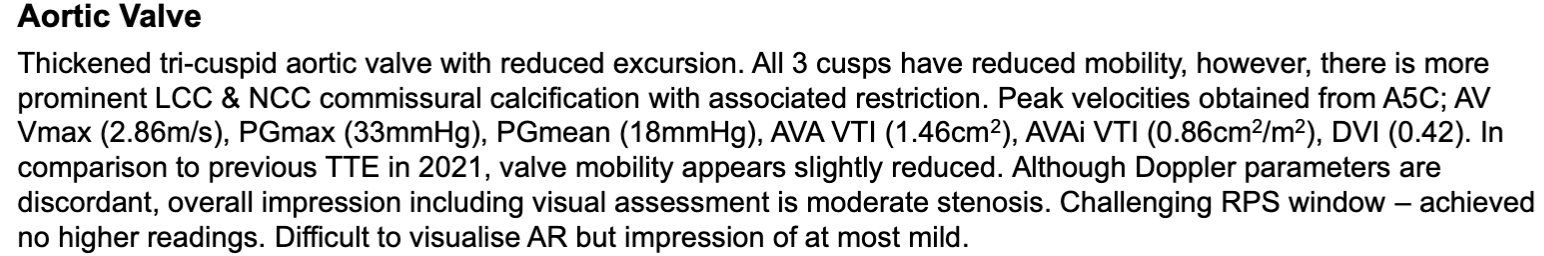
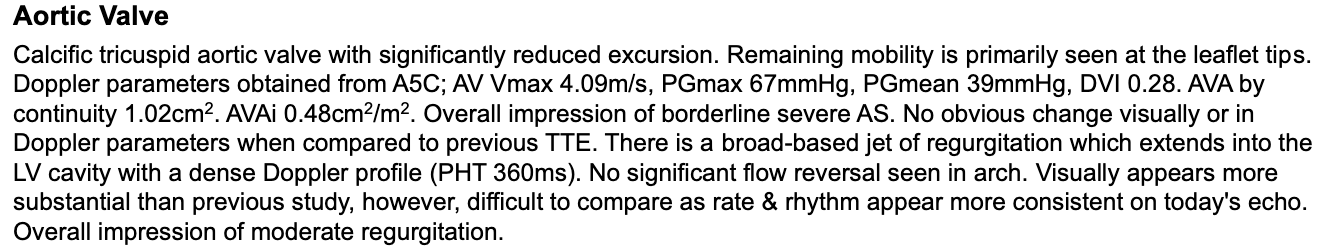
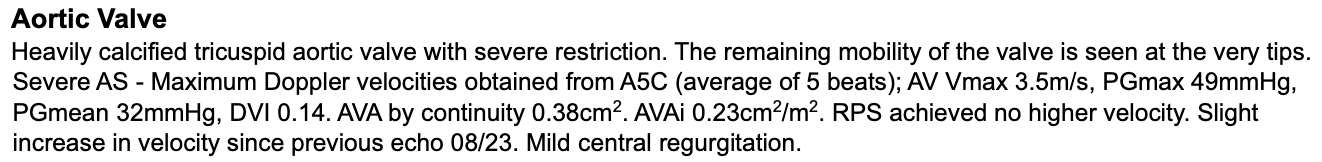
When reporting aortic stenosis (AS), include severity grading using standard parameters: mild (AVA > 1.5 cm², mean gradient < 20 mmHg), moderate (AVA 1.0–1.5 cm², gradient 20–40 mmHg), and severe (AVA < 1.0 cm², gradient > 40 mmHg). Address discordant findings, such as a low AVA with low gradients, which may indicate low-flow, low-gradient AS; evaluate stroke volume index (SVI) or consider dobutamine stress echocardiography to differentiate true severe from pseudo-severe AS. Some cases may have values suggesting 2 severities, in this case, moderate-severe AS for example would be okay. Describe valve morphology, noting calcification, leaflet thickening, and mobility, as these features support severity grading—severe calcification with significantly restricted leaflets often indicates severe AS even with borderline Doppler findings. Provide a concise summary combining grading, morphology, and clinical relevance, while recommending follow-up or intervention as needed. It is also important to note where you found the highest velocity so follow-up scans know where to try.
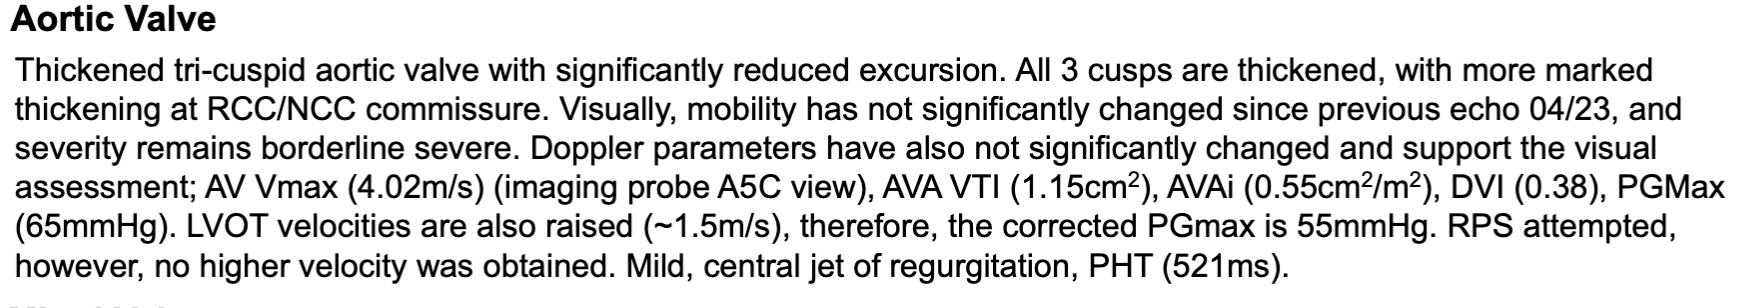
Example reports
Aortic regurgitation
Aortic regurgitation (AR) occurs when the aortic valve fails to close completely during diastole, allowing blood to flow back from the aorta into the left ventricle (LV). This results in volume overload, leading to left ventricular dilatation and, over time, potential systolic dysfunction. AR can be caused by valve abnormalities (e.g., bicuspid valve, infective endocarditis) or aortic root pathology (e.g., dilation in connective tissue disorders). Symptoms often include dyspnoea, fatigue, and signs of heart failure in advanced stages. Echocardiography is crucial for assessing AR severity, regurgitant volume, and its impact on LV size and function, guiding clinical management.

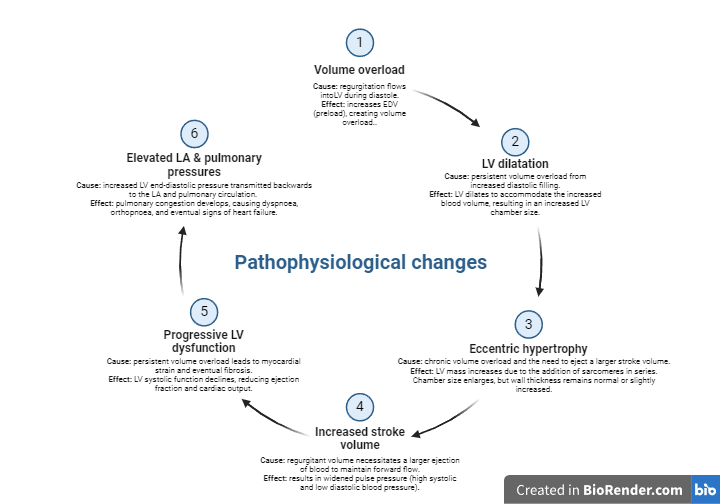
Causes & pathophysiological changes
Aortic regurgitation (AR) can result from a variety of conditions, but the most common causes include valve abnormalities (e.g., bicuspid valve, infective endocarditis, or rheumatic heart disease) and aortic root pathology (e.g., aortic dilation in Marfan syndrome or connective tissue disorders). This is not an exhaustive list, but these are the primary contributors to chronic AR. Acute AR, on the other hand, is typically caused by sudden events such as aortic dissection, infective endocarditis, or trauma, and presents with distinct pathophysiological changes.
In chronic AR, the regurgitation leads to volume overload in the left ventricle (LV), resulting in LV dilatation and eccentric hypertrophy to maintain cardiac output. Over time, persistent strain causes myocardial fibrosis, leading to LV systolic dysfunction and symptoms of heart failure, such as dyspnoea and fatigue.
In acute AR, the sudden regurgitation overwhelms the LV, which lacks the time to adapt. This leads to a rapid rise in LV end-diastolic pressure, causing severe pulmonary oedema and cardiogenic shock. Acute AR is a medical emergency requiring prompt intervention.
Understanding these causes and pathophysiological changes is crucial for recognising AR severity and tailoring management.